Qualitative Data Analysis Software (QDAS) allows researchers to organize, analyze and visualize their data, finding the patterns in qualitative data or unstructured data: interviews, surveys, field notes, videos, audio files, images, journal articles interviews, web content etc.
Quantitative vs. Qualitative Data Analysis
What is the difference between quantitative and qualitative data analysis. As the name implies, quantitative data analysis has to do with numbers. For example, any time you are doing statistical analysis, you are doing quantitative data analysis. Some examples of quantitative data analysis software are SPSS, STATA, SAS, and Lumivero’s own powerful statistics software, XLSTAT.
In contrast, qualitative data analysis "helps you understand people’s perceptions and experiences by systematically coding and analyzing the data", as described in Qualitative vs Quantitative Research 101. It tends to deal more with words than numbers. It can be useful when working with a lot of rich and deep data and when you aren’t trying to test something very specific. Some examples of qualitative data analysis software are MAXQDA, ATLAS.ti, Quirkos, and Lumivero’s NVivo, the leading qualitative data analysis software.
When would you use each one? Well, qualitative data analysis is often used for exploratory research or developing a theory, whereas quantitative is better if you want to test a hypothesis, find averages, and determine relationships between variables. With quantitative research you often want a large sample size to get relevant statistics. In contrast, qualitative research, because so much data in the form of text is involved, can have much smaller sample sizes and still yield valuable insights.
Of course, it’s not always so cut and dry, and many researchers end up taking a «mixed methods» approach, meaning that they combine both types of research. In this case they might use a combination of both types of software programs.
Learn how some qualitative researchers us QDA software in the on-demand webinar Twenty-Five Qualitative Researchers Share How-To's for Data Analysis.

How is Qualitative Data Analysis Software Used for Research?
Qualitative Data Analysis Software works with any qualitative research methodology used by a researcher For example, QDAS can be used by a social scientist wanting to develop new concepts or theories may take a ‘grounded theory’ approach. Or a researcher looking for ways to improve health policy or program design might use ‘evaluation methods’. QDAS, like NVivo doesn’t favor a particular methodology—it’s designed to facilitate common qualitative techniques no matter what method you use.
NVivo can help you to manage, explore and find patterns in your data but it cannot replace your analytical expertise.
Qualitative Research as an Iterative Process
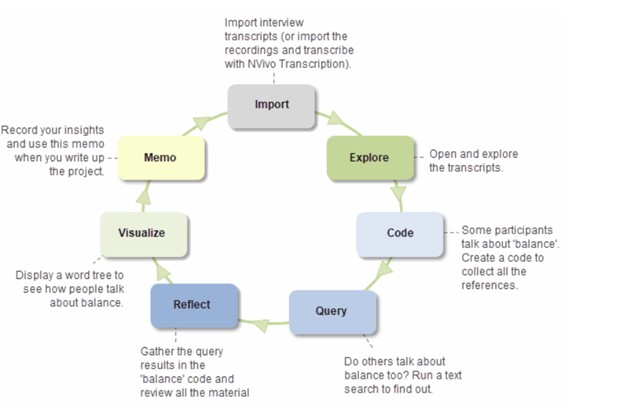
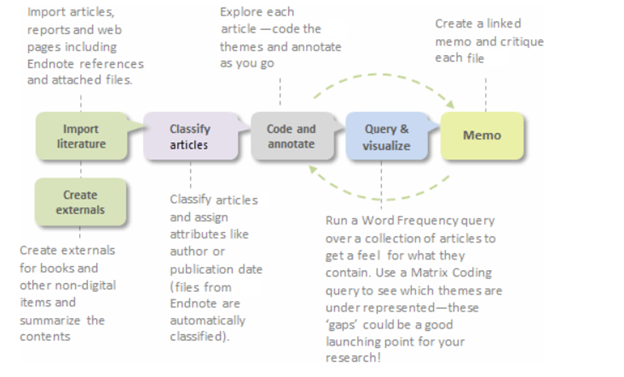
Handling qualitative data is not usually a step-by-step process. Instead, it tends to be an iterative process where you explore, code, reflect, memo, code some more, query and so on. For example, this picture shows a path you might take to investigate an interesting theme using QDAS, like NVivo:
How Do I Choose the Best Approach for My Research Project with QDAS?
Every research project is unique — the way you organize and analyze the material depends on your methodology, data and research design.
Here are some example scenarios for handling different types of research projects in QDAS—these are just suggestions to get you up and running.
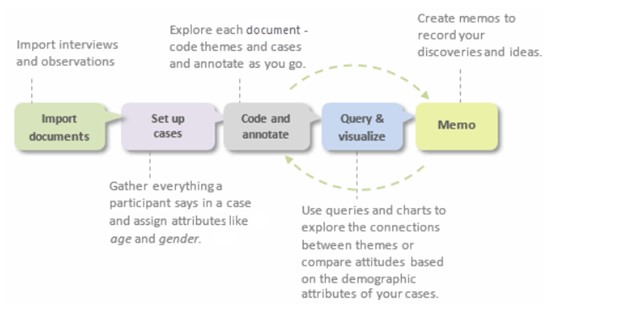
A study with interviews exploring stakeholder perception of a community arts program
Your files consist of unstructured interview documents. You would set up a case for each interview participant, then code to codes and cases. You could then explore your data with simple queries or charts and use memos to record your discoveries.
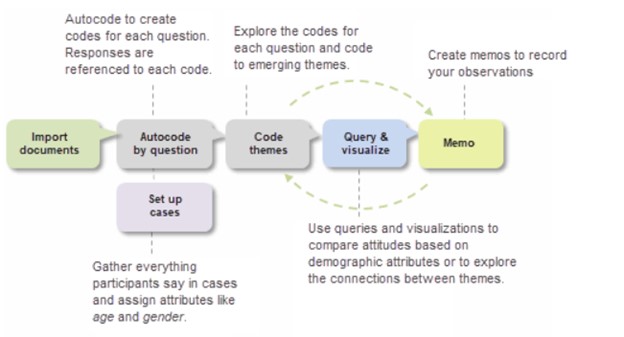
A study exploring community perceptions about climate change using autocoding with AI
Your files consist of structured, consistently formatted interviews (where each participant is asked the same set of questions). With AI, you could autocode the interviews and set up cases for each participant. Then code themes to query and visualize your data.
A literature review on adolescent depression
Your files consist of journal articles, books and web pages. You would classify your files before coding and querying them; and then you could critique each file in a memo. With Citavi integration in NVivo, you can import your Citavi references into NVivo.
A social media study of the language used by members of an online community
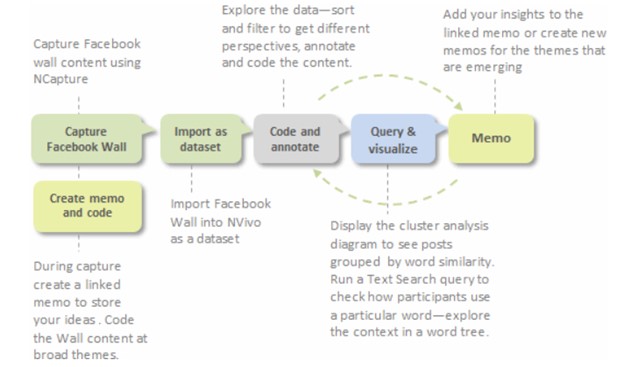
Your files consist of Facebook data captured with NCapture. You would import it as a dataset ready to code and query. Use memos to record your insights.
A quick analysis of a local government budget survey
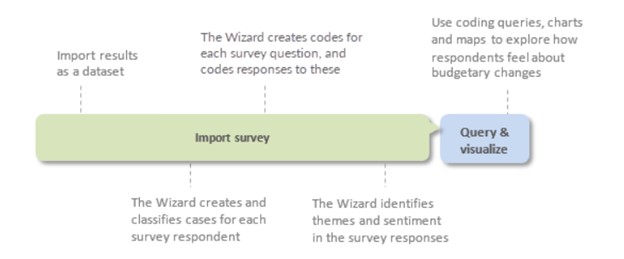
Your file is a large dataset of survey responses. You would import it using the Survey Import Wizard, which prepares your data for analysis. As part of the import, choose to run automated insights with AI to identify and code to themes and sentiment so that you can quickly review results and report broad findings.
Ways to Get Started with Your Project with QDAS
Since projects (and researchers) are unique there is no one 'best practice' approach to organizing and analyzing your data but there are some useful strategies to help you get up and running:
- Start now - don't wait until you have collected all the data. Import your research design, grant application or thesis proposal.
- Make a project journal and state your research questions and record your goals. Why are you doing the project? What is it about? What do you expect to find and why?
- Make a mind map for your preliminary ideas. Show the relationships or patterns you expect to find in your data based on prior experience or preliminary reading.
- Import your interviews, field notes, focus groups —organize these files into folders for easy access.
- Set up an initial code structure based on your early reading and ideas—you could run a Word
Frequency query over your data to tease out the common themes for creating your code structure. - Set up cases for the people, places or other cases in your project.
- Explore your material and code themes as they emerge in your data mining —creating memos and describing your discoveries and interpretations.
- To protect your work, get in the habit of making regular back-ups.
QDAS helps you work toward outcomes that are robust and transparent
Using QDAS, like NVivo to organize and analyze your data also increases the 'transparency' of your research outcomes—for example, you can:
- Demonstrate the evolution of your ideas in memos and maps.
- Document your early preconceptions and biases (in a memo or map) and demonstrate how these have been acknowledged and tested.
- Easily find illustrative quotes.
- Always return to the original context of your coded material.
- Save and revisit the queries and visualizations that helped you to arrive at your conclusions.
QDAS, like NVivo can demonstrate the credibility of your findings in the following ways:
- If you used NVivo for your literature review, run a query or create a chart to demonstrate how your findings compare with the views of other authors.
- Was an issue or theme reported by more than one participant? Run a Matrix Coding query to see how many participants talked about a theme.
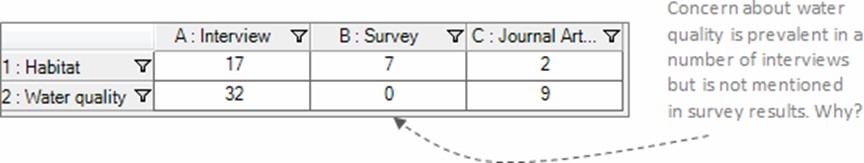
- Were multiple methods used to collect the data (interviews, observations, surveys)—and are the findings supported across these data files? Run a Matrix Coding query to see how often a theme is reported across all your files.
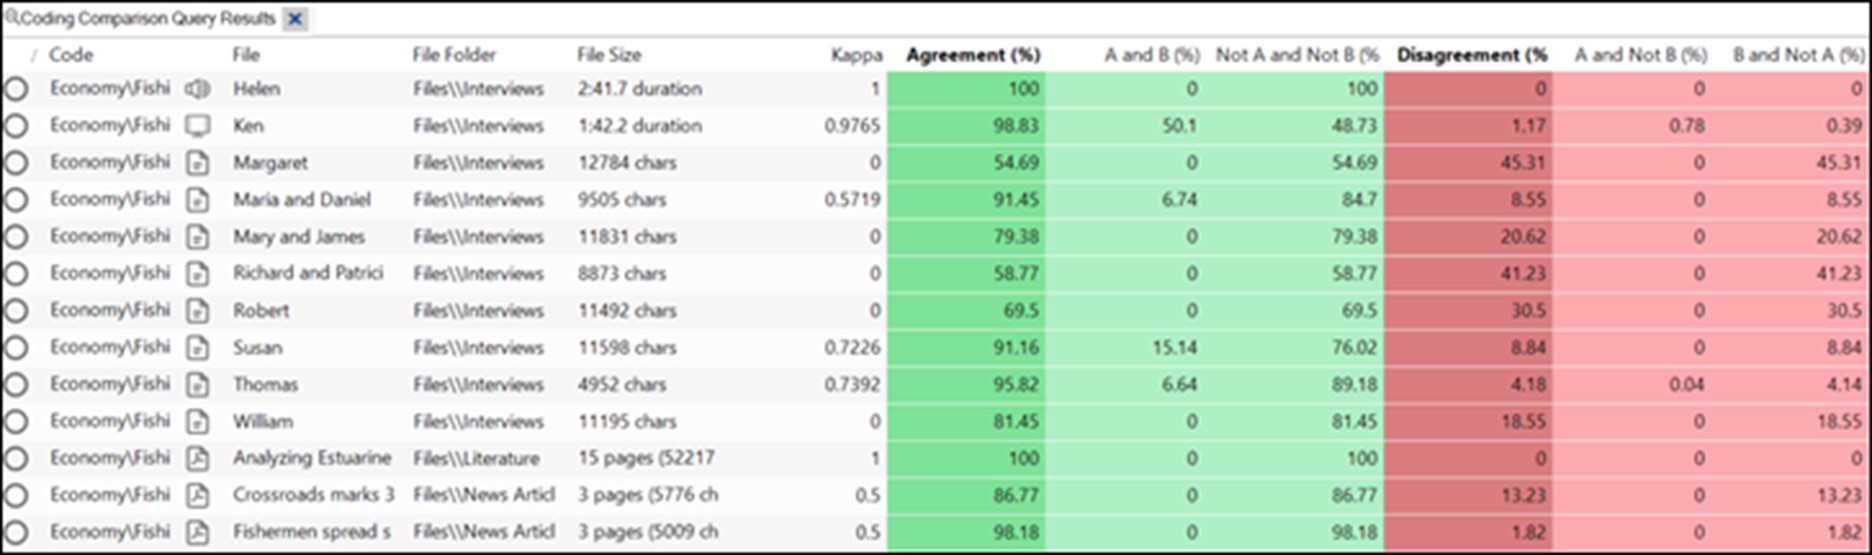
- If multiple researchers analyzed the material—were their findings consistent? Use coding stripes (or filter the contents in a code) to see how various team members have coded the material and run a Coding Comparison query to assess the level of agreement.
QDAS Integrations
Many QDAS have integration with other software to enhance your research process. NVivo integrates or can be used with the following software:
- NVivo Transcription to save you time and jump start your qualitative data analysis. Learn how in the on-demand webinar Transcription – Go Beyond the Words.
- Reference management software, like Lumivero’s Citavi, for reference management and writing. By combining Citavi and NVivo, you can create complicated searches for certain keywords, terms, and categories and make advanced search syntax, like wildcards, boolean operators, and regular expressions. This integration allows you to take your analyses beyond reference management by developing a central location to collect references and thoughts, analyze literature, and connect empirical data.
- Statistical software, like Lumivero’s XLSTAT, SPSS, or STATA to export your queries from NVivo to run statistical analysis
- Qualtrics, SurveyMonkey to import your survey results into NVivo to start analyzing.
To learn more about how QDAS, like NVivo can assist you with your research trail, request a free 14-day trial of NVivo or request a demonstration.